US Dividend GROWTH
Inception:
May 2014
7%
Median DGR¹
GIPS
Compliant Firm²
U.S. Dividend GROWTH
Inception:
May 2014
7%
GIPS
Compliant Firm²
Incepted in May 2014, the Blue Current US Dividend Growth strategy builds on the team’s decade of global investing experience to select high quality, US-based dividend-paying companies. The primary objectives are to pay a stable and increasing dividend each quarter and deliver attractive long-term capital appreciation to investors.
The Blue Current investment team concentrates on a select portfolio of 35-45 US domiciled companies that meet our stringent qualities. We focus on companies that we believe have a history of rewarding shareholders and have the financial ability to continue to increase the dividend over time. We strive to purchase those businesses when they are trading at a discount to their true value, delivering to investors a total return solution.
- Concentrated with 35 to 45 companies
- Focused on US domiciled companies
- Process emphasizes companies with rising dividends
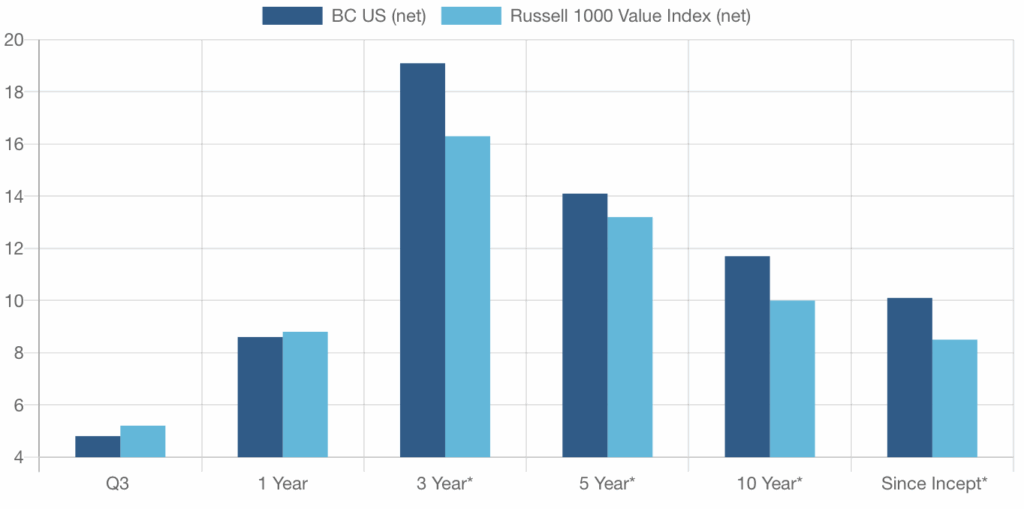
HISTORICAL TOTAL RETURNS
(*annualized)
Portfolio Qualities
Std Deviation Since Inception
14.0%
Positions
35
Median Market Cap ($bn)
$126
Dividend Yield
2.1%
TR One Year Median Div Growth
6.7%
Net debt to EBITDA
1.7
Media Return on Equity
22.6%
Trailing Weighted PE
20.6
Forward Weighted EPS Growth
13.4%
Forward Weighted PE
18.1
Forward Weighted EPS Growth
10.0%
Top 10 Holdings
Weighting
RTX Corporation
4.4%
J.P. Morgan Chase & Co.
4.0%
Broadcom Inc.
3.9%
Microsoft Corporation
3.3%
Morgan Stanley
3.3%
Chevron Corporation
3.3%
Johnson & Johnson
3.2%
Oracle Corporation
3.0%
Targa Resources Group
3.0%
Highwoods Properties, Inc.
3.0%
Sector Exposure
Strategy
Russell 1000 Value Index
Difference
Consumer Discretionary
2.2%
7.7%
-5.5%
Consumer Staples
10.8%
7.6%
3.2%
Energy
6.3%
5.9%
0.4%
Financials
19.9%
22.6%
-2.7%
Health Care
7.5%
11.7%
-4.2%
Industrials
16.7%
13.1%
3.6%
Information Technology
16.8%
10.5%
6.3%
Materials
1.7%
4.2%
-2.5%
REITS
8.4%
4.2%
4.2%
Telecommunications
0.0%
7.9%
-7.9%
Utilities
2.9%
4.6%
-1.7%
Cash
6.8%
0.0%
6.8%
| SECTOR EXPOSURE | Strategy | Russell 1000 Index Value | Difference |
|---|---|---|---|
| Consumer Discretionary | 2.2% | 7.7% | -5.5% |
|
Consumer Staples |
10.8% | 7.6% | 3.2% |
| Energy | 6.3% | 5.9% | 0.4% |
| Financials | 19.9% | 22.6% | -2.7% |
| Health Care | 7.5% | 11.7% | -4.2% |
| Industrials | 16.7% | 13.1% | 3.6% |
| Information Technology | 16.8% | 10.5% | 6.3% |
| Materials | 1.7% | 4.2% | -2.5% |
| REITS | 8.4% | 4.2% | 4.2% |
| Telecommunications | 0.0% | 7.9% | -7.9% |
| Utlilites | 2.9% | 4.6% | -1.7% |
| Cash | 6.8% | 0.0% | 6.8% |