International Dividend GROWTH
Inception:
April 2021
12%
Median DGR¹
GIPS
Compliant Firm²
International Dividend GROWTH
Inception:
April 2021
12%
GIPS
Compliant Firm²
The Blue Current International Dividend Growth strategy invests in a diverse portfolio (30-40 stocks) of dividend-paying securities domiciled in developed-markets that are committed to rewarding shareholders through dividend growth and share buybacks. We believe that over the long-term, dividend growth and quality investing leads to above-average compounded returns.
We select securities from the MSCI World-Ex US universe. We do not invest in emerging markets but seek to exploit those growth trends through investments in companies domiciled in developed markets. Each portfolio company will be committed to long-term dividend growth and we seek to have exposure to a variety of currencies. No country or sector will represent more than 30% of the portfolio.
We have a value-based approach that identifies businesses with industry leading fundamentals including return on capital, balance sheet quality, free cash flow generation and friendly shareholder governance policies that reward investors through the cycle. We seek to invest in these businesses when there is an identifiable catalyst capable of closing the price discount to our calculated intrinsic value.
- Concentrated with 30 to 40 companies
- Emphasis on International-developed markets
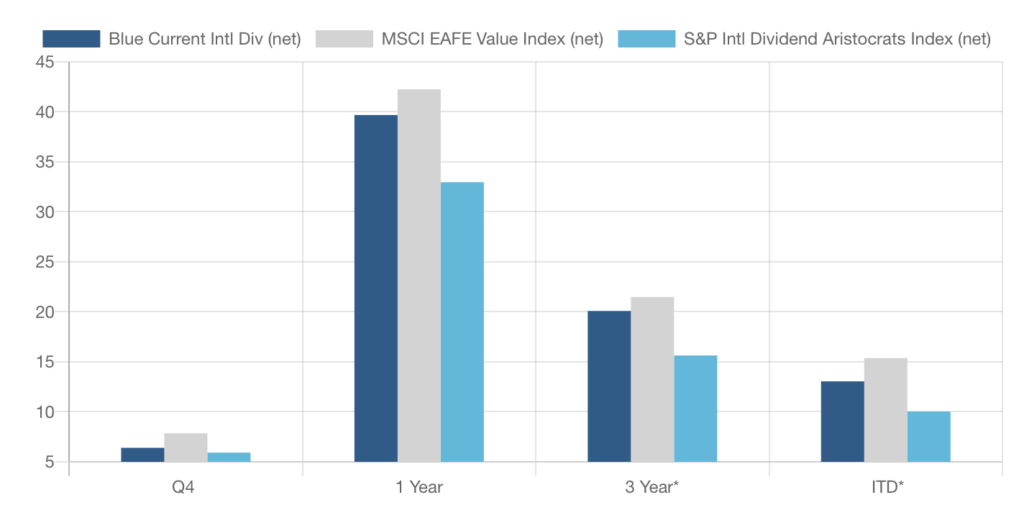
HISTORICAL TOTAL RETURNS
(*annualized)
Portfolio Qualities
Positions
32
Median Market Cap ($bn)
$134
Dividend Yield (gross)
2.2%
Dividend Coverage Ratio
2.9
Net debt to EBITDA
1.6
Trailing Weighted PE
19.3
Trailing Weighted EPS Growth
15.8%
Forward Weighted PE
17.4
Forward Weighted EPS Growth
10.1%
Top 10 Holdings
Weighting
Taiwan Semiconductor
4.3%
LVMH Moet Hennessy Louis Vuitton SE
4.1%
UBS Group AG
3.9%
Danone SA
3.8%
Allianz SE
3.7%
Shell PLC
3.7%
AstraZeneca PLC
3.6%
National Bank of Canada
3.6%
Roche Holding Ltd
3.5%
Nestle SA
3.5%
Sector Exposure
Portfolio Weights
S&P Intl Dividend Aristocrats
Difference
Consumer Discretionary
7.2%
4.2%
3.0%
Consumer
Staples
13.6%
1.4%
12.2%
Energy
6.8%
4.8%
2.0%
Financials
22.8%
26.2%
-3.4%
Health Care
12.5%
3.8%
8.7%
Industrials
17.6%
10.4%
7.2%
Information Technology
6.6%
1.0%
5.6%
Telecommunications
5.3%
10.3%
-5.1%
Materials
3.0%
3.7%
-0.8%
REITS
0.0%
13.1%
-13.1%
Utilities
0.0%
21.2%
-21.2%
Cash
4.7%
0.0%
4.7%
Country Exposure
Portfolio Weights
S&P Intl Dividend Aristocrats
Difference
France
17.9%
3.2%
14.7%
Germany
11.2%
2.9%
8.3%
United Kingdom
20.9%
5.6%
15.3%
Japan
9.0%
13.5%
-4.5%
Switzerland
14.2%
7.1%
7.1%
Hong Kong, China
0.0%
7.7%
-7.7%
Other
26.8%
60.0%
-33.2%
| SECTOR EXPOSURE | Portfolio Weights | S&P Intl Dividend Aristocrats | Difference |
|---|---|---|---|
| Consumer Discretionary | 7.2% | 4.2% | 3.0% |
|
Consumer Staples |
13.6% | 1.4% | 12.2% |
| Energy | 6.8% | 4.8% | 2.0% |
| Financials | 22.8% | 26.2% | -3.4% |
| Health Care | 12.5% | 3.8% | 8.7% |
| Industrials | 17.6% | 10.4% | 7.2% |
| Information Technology | 6.6% | 1.0% | 5.6% |
| Telecommunications | 5.3% | 10.3% | -5.1% |
| Materials | 3.0% | 3.7% | -0.8% |
| REITS | 0.0% | 13.1% | -13.1% |
| Utlilites | 0.0% | 21.2% | -21.2% |
| Cash | 4.7% | 0.0% | 4.7% |
| COUNTRY EXPOSURE | Portfolio Weights | S&P Intl Dividend Aristocrats | Difference |
|---|---|---|---|
| France | 17.9% | 3.2% | 14.7% |
| Germany | 11.2% | 2.9% | 8.3% |
|
United Kingdom |
20.9% | 5.6% | 15.3% |
| Japan | 9.0% | 13.5% | -4.5% |
| Switzerland | 14.2% | 7.1% | 7.1% |
|
Hong Kong, China |
0.0% | 7.7% | -7.7% |
| Other | 26.8% | 60.0% | -33.2% |