Concentrated portfolio of companies committed to rewarding shareholders through sustainable and growing dividends, targeting a 10% growth rate in dividends over the long-term.
The Blue Current Global Dividend Growth strategy utilizes its investment expertise in growing cash flow through what we believe is a niche universe of high quality, dividend-paying companies with sustainable business models and dividend policies. The primary objectives are to pay a stable and increasing dividend each quarter and deliver attractive long term capital appreciation to investors.
The Blue Current investment team concentrates on a select portfolio of 35-50 companies across developed markets that meet our stringent qualities. We focus on companies that we believe have a history of rewarding shareholders and have the financial ability to continue to increase the dividend over time. We also focus on the future earnings potential of each company and strive to purchase those businesses when they are trading at a discount to their true value.
Invests at least 40% of the portfolio in companies domiciled outside the US
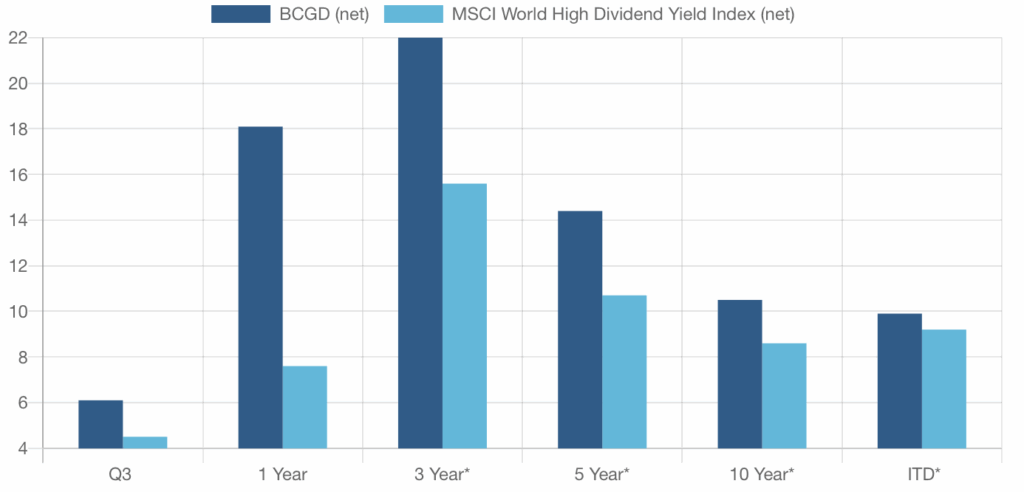
HISTORICAL TOTAL RETURNS
(*annualized)
Portfolio Qualities
Std Deviation (since inception)
13.2%
Positions
38
Median Market Cap ($bn)
$117
Dividend Yield (gross)
2.2%
Dividend Coverage Ratio
3.2
Net debt to EBITDA
1.6
Trailing Weighted PE
19.8
Trailing Weighted EPS Growth
15.1%
Forward Weighted PE
17.4
Forward Weighted EPS Growth
10.8%
Top 10 Holdings
Weighting
Broadcom
4.4%
Mitsubishi UFJ Financial Corp.
3.7%
RTX Corportation
3.7%
Johnson & Johnson
3.4%
Morgan Stanley
3.3%
Microsoft Corporation
3.3%
HCA Healthcare Inc.
3.2%
Danone SA
3.1%
JPMorgan Chase & Co.
3.0%
Thales SA
3.0%
Sector Exposure
Weighting
Consumer Discretionary
1.8%
Energy
5.1%
Financials
24.0%
Healthcare
14.1%
Industrials
14.0%
Materials
0.0%
REITS
4.1%
Consumer Staples
16.8%
Technology
16.8%
Utilities
0.0%
Cash
3.3%
Country Exposure
Weighting
United States
48%
United Kingdom
13%
France
8%
Japan
7%
Other
23%
Scroll to Top
Important Disclosures
¹ Historical dividend growth rate is calculated annually and represents the year over year growth in cumulative dividends received across a sample of individual portfolios with no inflows or outflows over the prior two years. Special dividends (non-recurring) are excluded from the calculation. Calculations are gross of dividend withholding tax. Past dividend growth is not necessarily indicative of future dividend growth.
² GIPS® is a registered trademark owned by CFA Institute. CFA Institute does not endorse or promote this organization, nor does it warrant the accuracy or quality of the content contained herein.